You must verify your project is passing the functionality tests to earn the project functionality grade as well as before every code review required to earn your design grade. This guide walks through that testing process.
This guide assumes you have already setup your project in Eclipse.
Walkthrough Video
The following video 33 minute video gives an overview of projects, how to test projects locally (starting at 13:53), testing projects remotely (starting at 24:33), and get your first functionality grade (starting at 29:38).
The version of Java and appearance of Eclipse may be slightly different between semesters.
Testing Locally
It is important to work and test the projects iteratively, as well as attempt to pass the tests locally before considering running the tests remotely.
Running Driver
When you first start, very little template code is provided. The tests provided only test the final output of your project, unlike the homework which has tests for individual methods. It will likely take some time before running the JUnit tests will be helpful.
Instead, you may want to start by running your Driver class directly using a Run Configuration and manually inspecting the output.
View Details
-
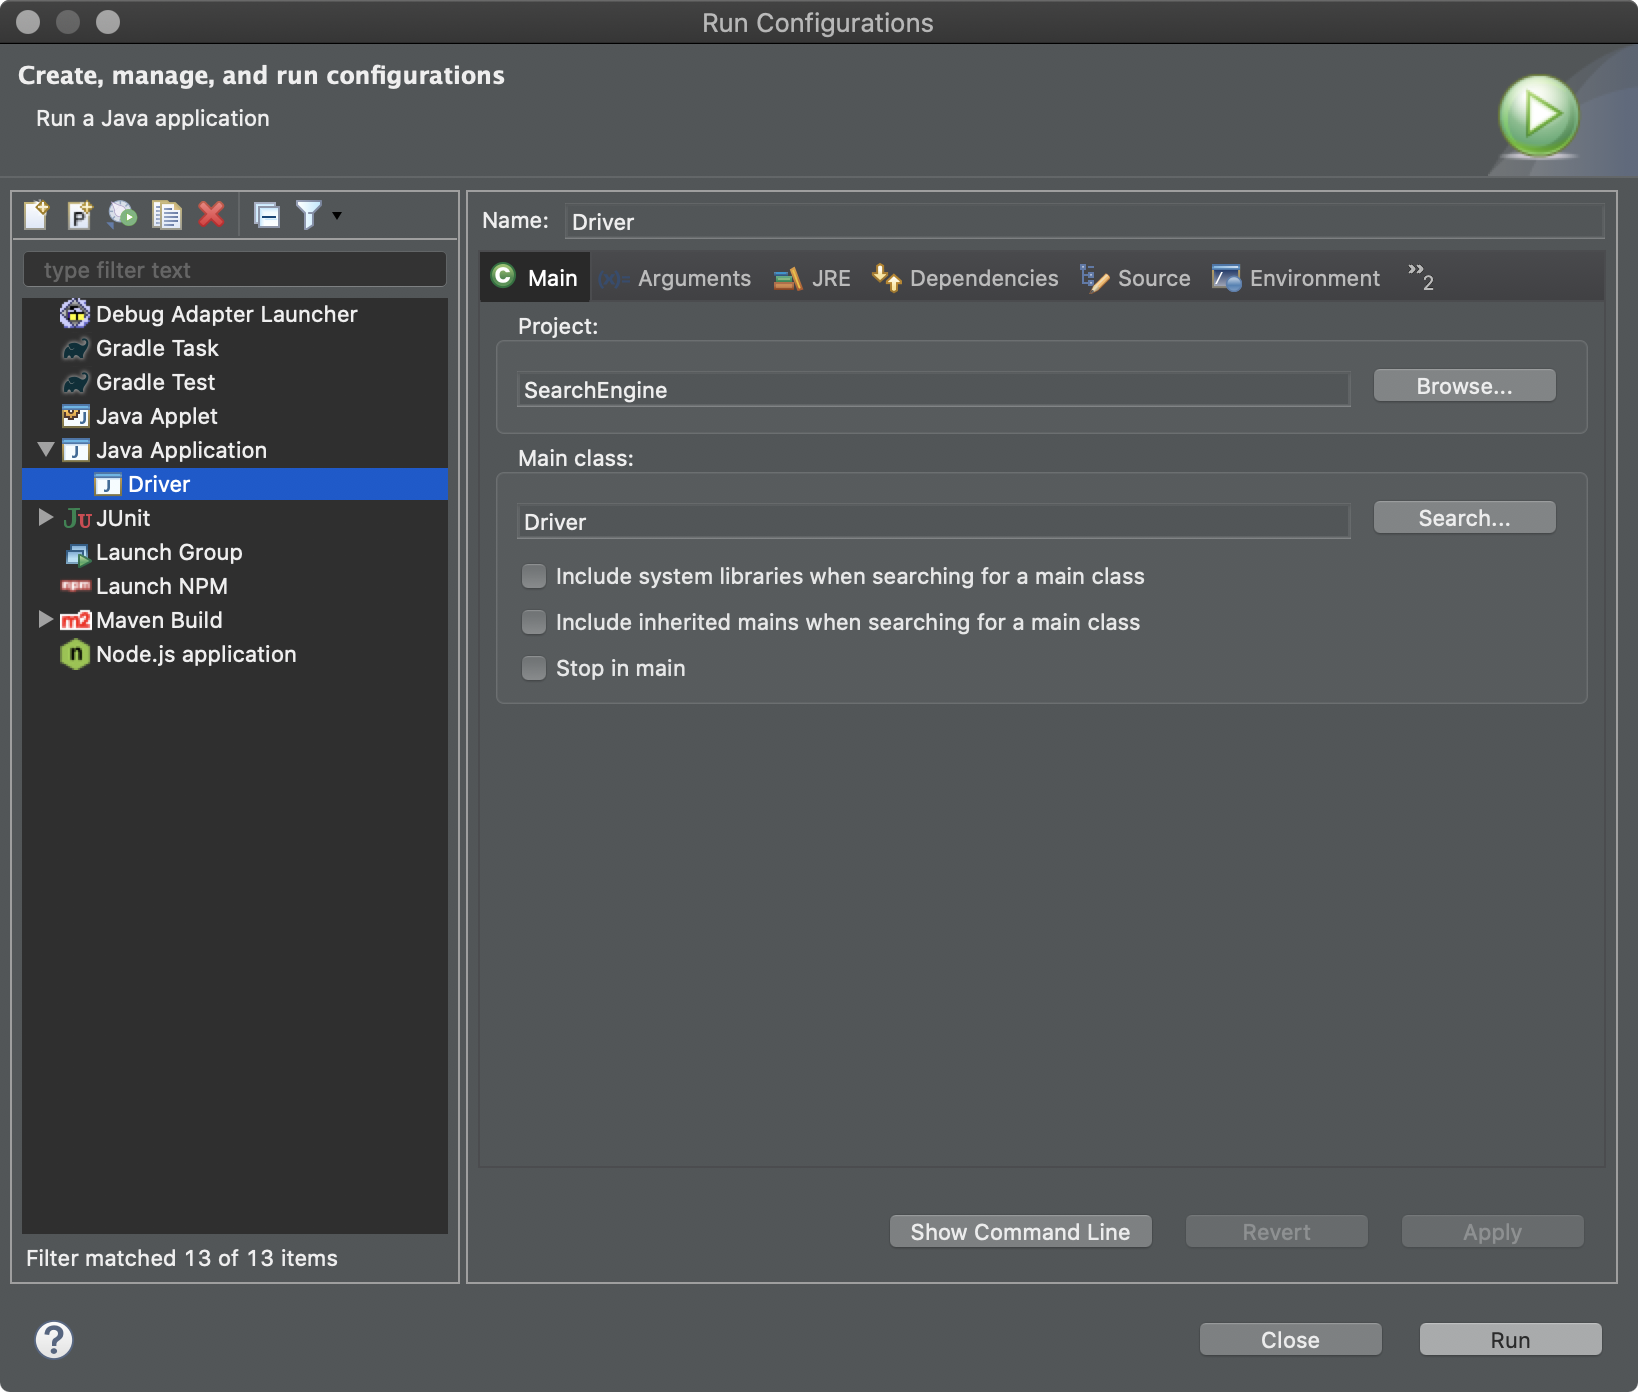
Go to the “Run” menu in the menubar at the top of Eclipse and select “Run Configurations…” from the dropdown.
-
Click on the “Java Application” category in the left view pane and click the “New Configuration” button (looks like a blank file with a +).
-
Enter any name you’d like in the “Name:” text box.
-
Next to the “Project:” text box, click the “Browse” button and select the “SearchEngine” project.
-
Next to the “Main class:” text box, click the “” button and select “Driver” from the list. At this point, your setup should look like this:
-
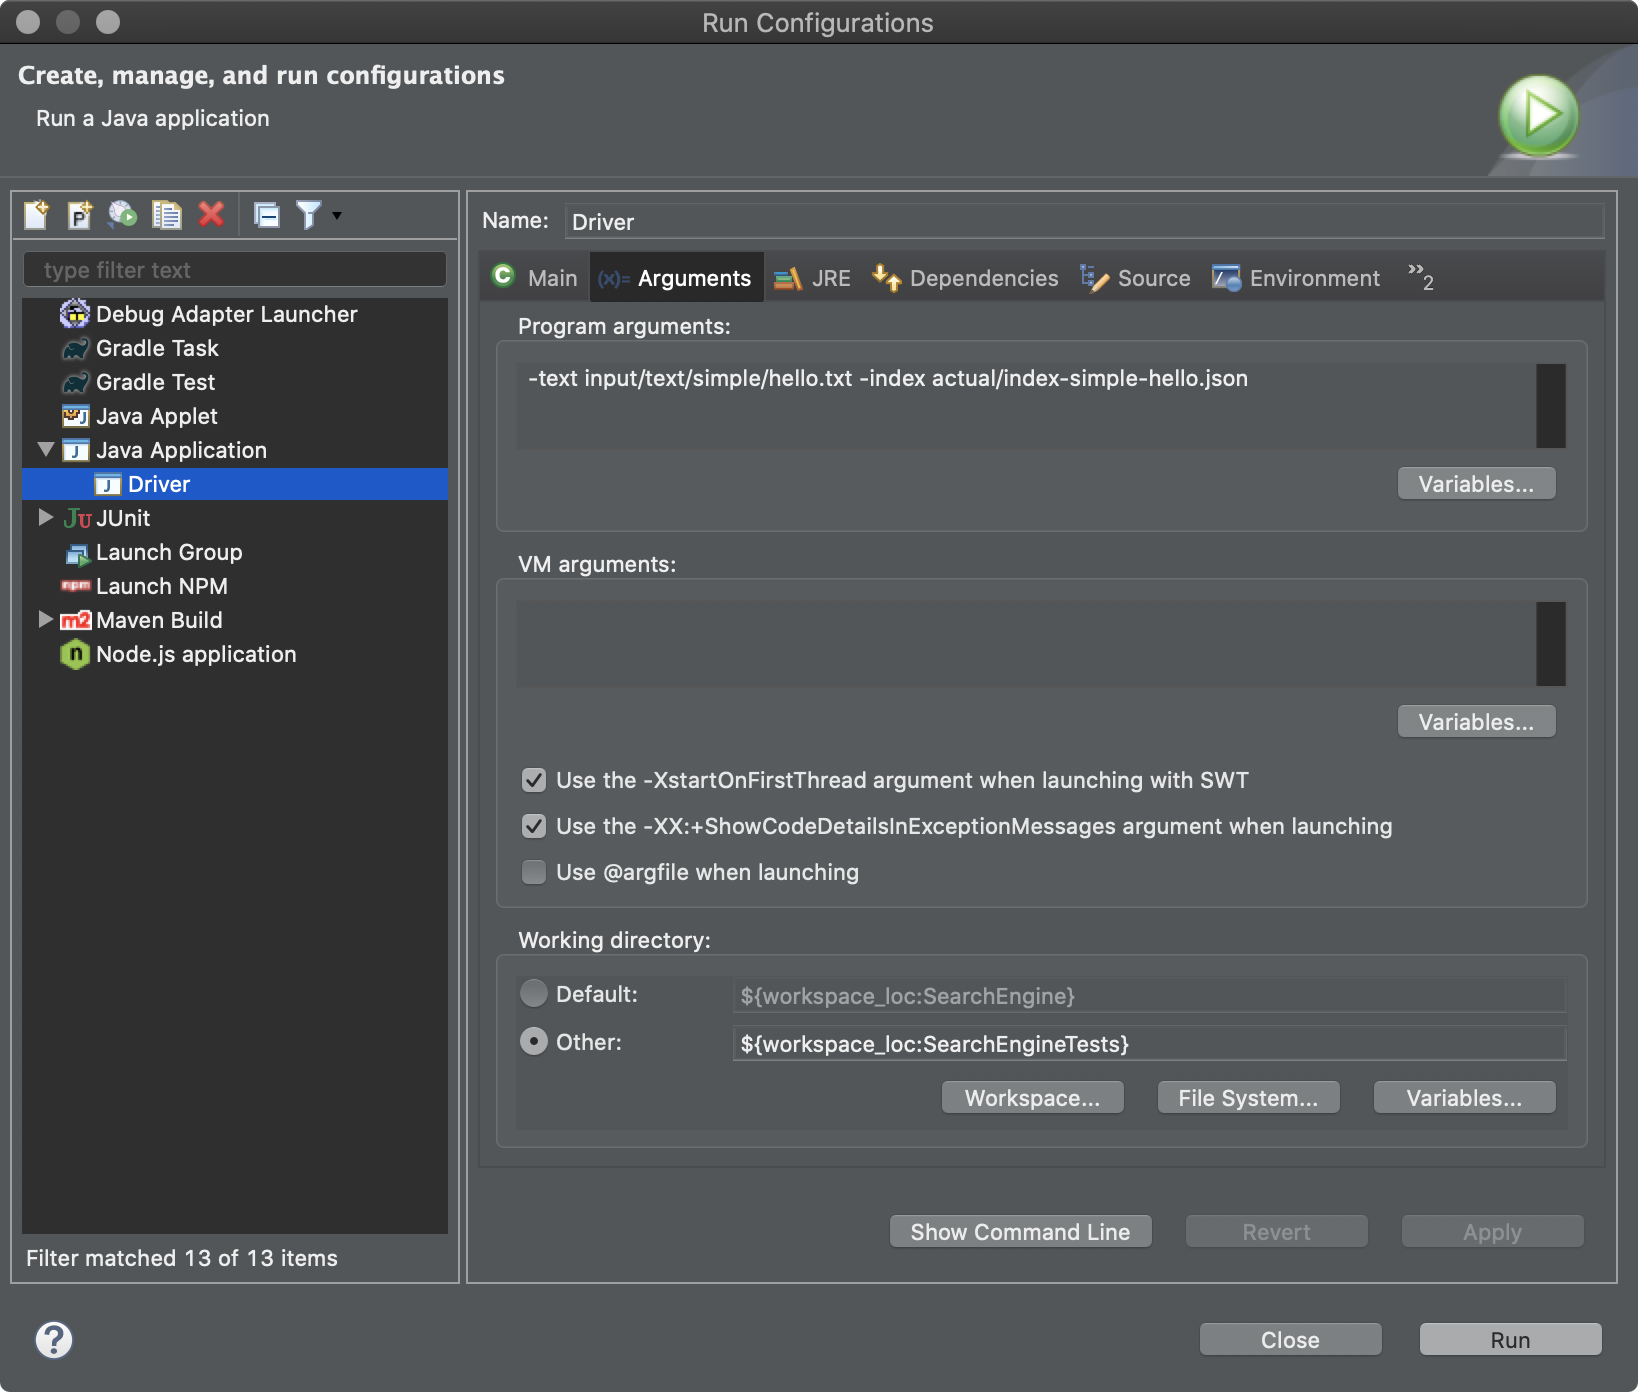
Click on the “Arguments” tab. Enter the following into the “Program arguments” text area:
-text input/text/simple/hello.txt -index actual/index-simple-hello.json…or if you are on Windows:
-text input\text\simple\hello.txt -index actual\index-simple-hello.jsonThis will run
Driverwith the same arguments as the first project 1 test. -
This next part is really important! Remember, all of the test files are in a SEPARATE repository. Change the “Working directory:” setting to the “Other:” choice.
-
Click the “Workspace…” button and select the “SearchEngineTests” project. At this point, your setup should look like this:
-
Click the “Apply” and “Run” buttons.
If you want you can download the Driver.launch configuration file and then go to the “Import” dialog window, open the “Run/Debug” section, and select “Launch Configurations” to import it into Eclipse.
You can keep running this same “Run Configuration” while debugging. If you are failing a specific JUnit test, you can copy/paste the arguments used by the test (provided in the failure output) to debug your code.
Running JUnit Tests
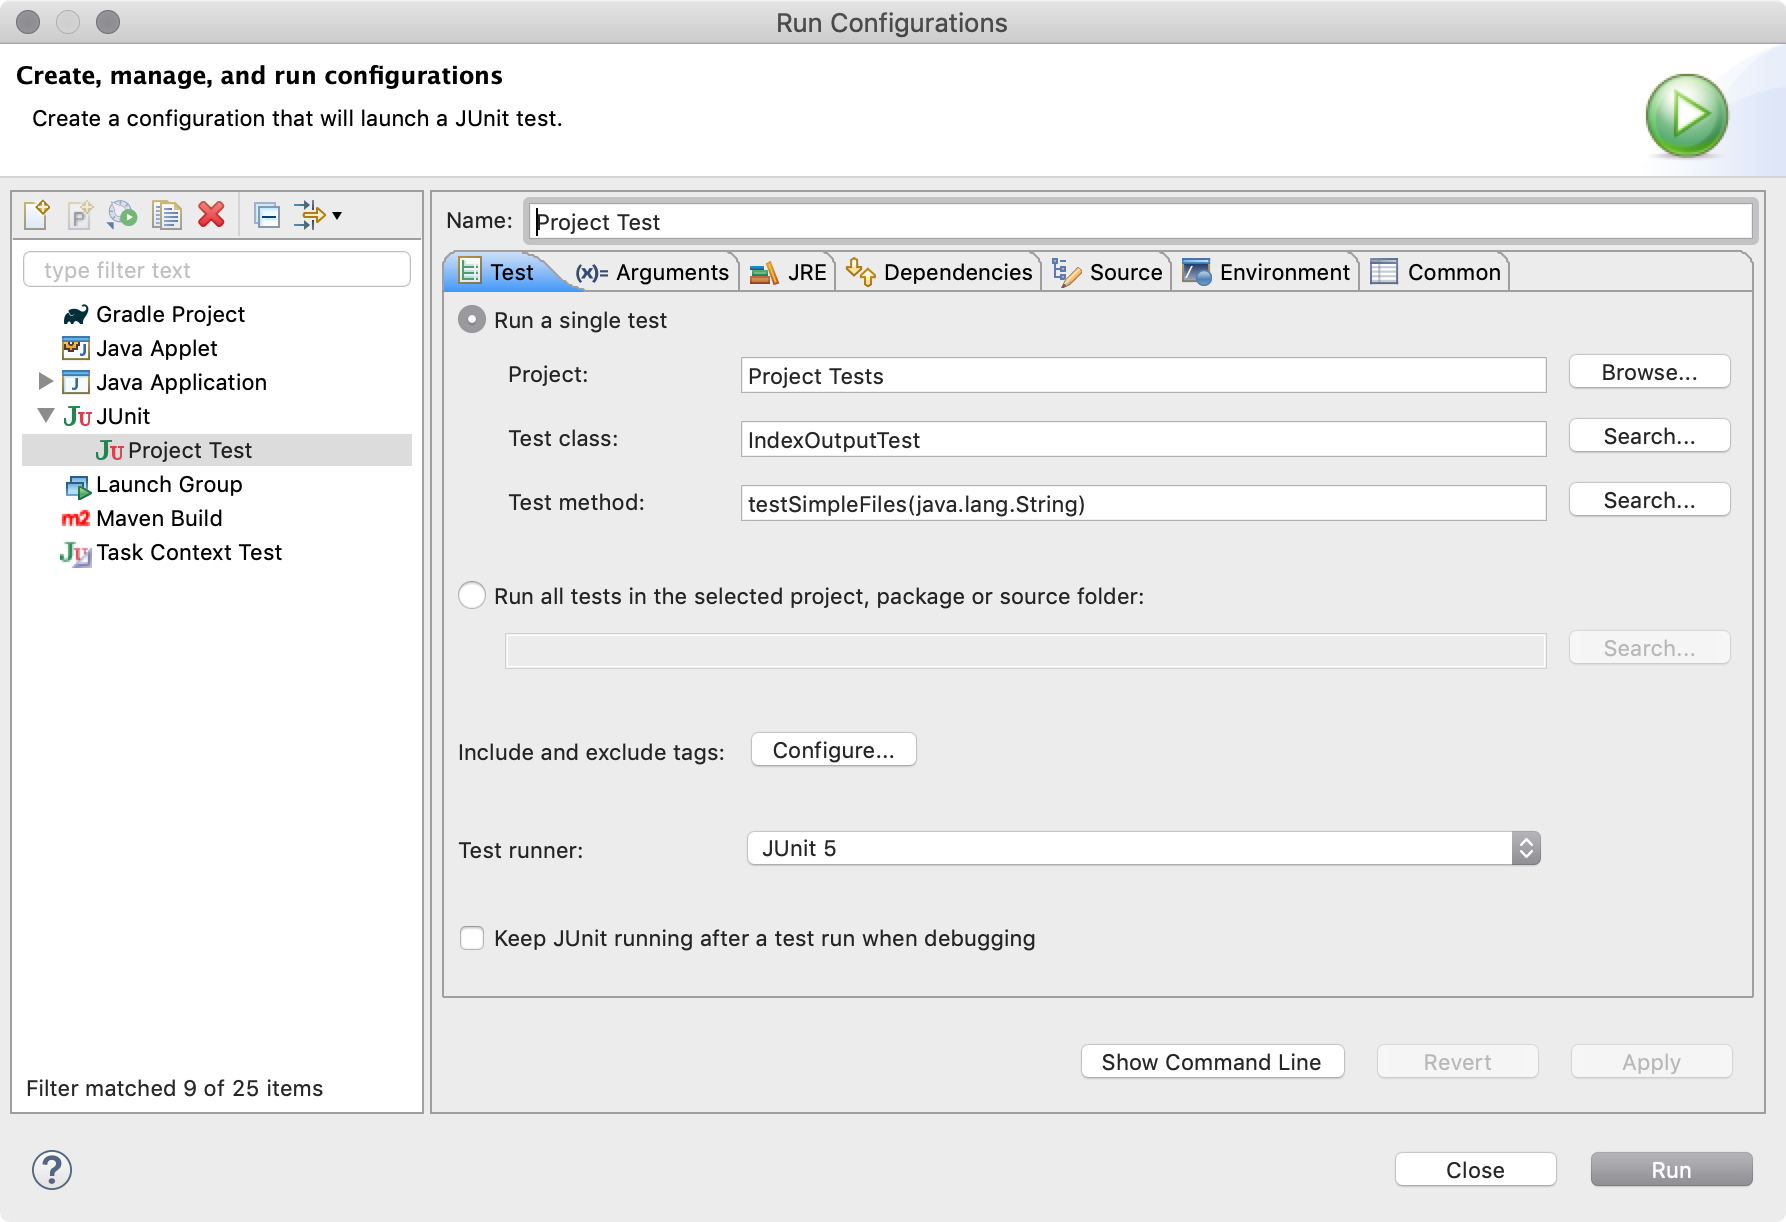
You must use the JUnit 5 tests provided with the project-tests repository to determine if your project is meeting the required functionality. The suite of tests for each project are given by the Project#Test.java files in the src subdirectory. For example, the tests for Project 1 are provided by the Project1Test.java file.
While you are initially working on the project, focus on individual tests or individual groups of tests. There is no need to run all of the tests every time; in fact this can make debugging harder! See the Homework Testing guide for different ways you can run individual JUnit tests. Here is an example run configuration:
Pay attention to the test output. The output tells you where to find the actual and expected output files and what caused the test to fail. It also tells you the arguments that were passed to your Driver class, which is helpful for debugging. The full output, which can be copied to the console for easy copying/pasting using the  button, includes the following text:
Actual File:
    actual/index-simple-hello.json
Expected File:
    expected/index/index-simple/index-simple-hello.json
Arguments:
    -text input/text/simple/hello.txt -index actual/index-simple-hello.json
Message:
    Difference detected on line: 2.
This gives the actual arguments passed to Driver by the test, the actual and expected files being compared, and where the first difference was detected. You can use the Compare Editor in Eclipse to compare the files side-by-side for debugging, or use the Run Configurations in Eclipse to enter the same arguments manually.
To save space, the tests automatically delete your output files if they match the expected output. Only output files for failing tests will be kept.
Running Maven
Most of the time, if you are passing the tests locally you will also pass them remotely. However, there are slight differences between how the tests are run by Eclipse and how they are run by Github Actions.
If you want to test out the same approach used by Github Actions, you have to use Maven to run the tests instead of the JUnit interface in Eclipse.
View Details
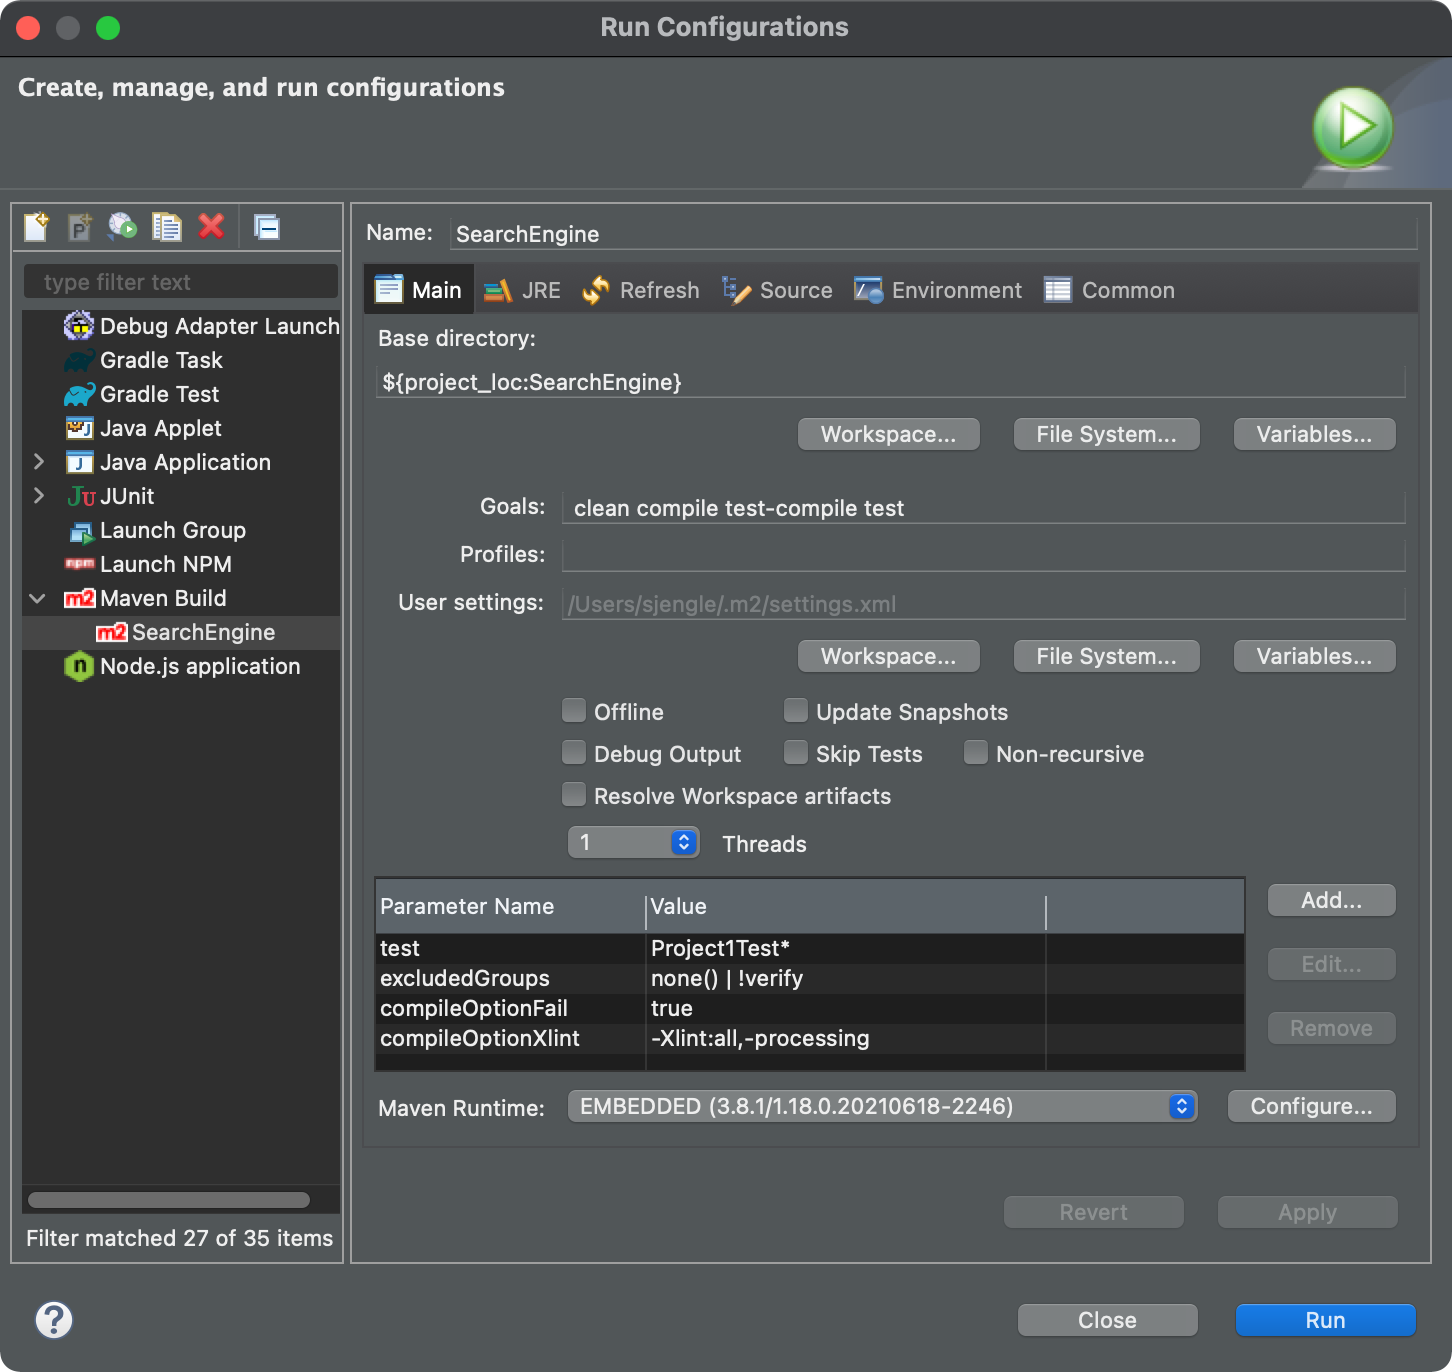
Here is a screenshot of the run configuration you must create:
Follow these steps to create this run configuration:
-
Go to the “Run” menu in the menubar at the top of Eclipse and select “Run Configurations…” from the dropdown.
-
Click on the “Maven Build” category in the left view pane and click the “New Configuration” button (looks like a blank file with a +).
-
Enter any name you’d like in the “Name:” text box.
-
Under the “Base directory:” text box, click the “Workspace” button and select the “SearchEngine” project.
-
Enter the following into the “Goals:” text box:
clean compile test-compile testThe
cleangoal removes all previously-compiled class files. Thecompilegoal compiles all of the main source code in themaindirectory and thetest-compilegoal compiles all of the test source code in thetestdirectory of theproject-testsrepository. Finally, thetestgoal runs the JUnit tests found in thetestdirectory. -
Next to the “Parameter Name” list, click the “Add…” button to add a parameter. Enter
testfor the “Name:” text box andProject#Test*for the “Value:” textbox, where#is the project number. For example, enterProject1Test*for Project 1. Click the “OK” button when done. -
[OPTIONAL] Click the “Add…” button to add another parameter. Enter
excludedGroupsandnone() | !verifyfor the name and value. This tells Maven to run all tests except those without tags, or those that don’t have theverifytag. Or, in other words, it only runs the tests tagged withverify, which finishes much faster than running all of the tests. This can be skipped if you want to run all of the tests regardless. -
[OPTIONAL] Click the “Add…” button to add another parameter. Enter
compileOptionXlintand-Xlint:all,-processing(with no spaces) for the name and value. This will tell Maven to check for all warnings (except annotation processing). This is only required if you are going to enable the next option to fail when warnings are detected. -
[OPTIONAL] Click the “Add…” button to add another parameter. Enter
compileOptionFailandtruefor the name and value. This tells Maven to fail if any compile warning are detected. If there are warnings, it will report those warnings and exit (it will not run the tests). This is not required to earn functionality credit, but will be required to sign up for a code review. -
Ignore the red
SLF4J:output at the beginning. Look for output similar to:[INFO] Running Project1Test$A_OutputTest Running: actual/index-text.json... Elapsed: 3.085000 seconds [INFO] Tests run: 1, Failures: 0, Errors: 0, Skipped: 0, Time elapsed: 3.336 s - in Project1Test$A_OutputTestMake sure you always see
Failures: 0. Otherwise, scroll up in the console output to see which tests failed.
If you want you can download the Driver (Maven).launch configuration file and then go to the “Import” dialog window, open the “Run/Debug” section, and select “Launch Configurations” to import it into Eclipse.
These steps are really only required for fine-grained debugging and can be skipped most of the time.
Testing Remotely
You must test your code remotely before you can earn credit for the functionality of your project and before you can sign up for a code review appointment.
This process begins by creating a release on Github. This will trigger the Github Action that verifies your project functionality.
Creating Releases
Creating releases will familiarize you with versioning your code.
-
After passing all of the tests locally and pushing your latest commits to Github, follow the Creating Releases steps to draft a new release of your project code on Github.
-
Choose a “tag” or the version number to assign to the code at this stage. Out in the “real world” you will likely use semantic versioning, which we will roughly mimic in class.
Specifically, you must name your release
v#.#.#where the first#is the project number (1, 2, 3, or 4), the second#is the number of code reviews you’ve had for that project, and the last#is the number of patches/fixes you released in between code reviews for that project.For example, your first release should be
v1.0.0because it is for project 1, you have not had any code reviews yet, and you have not had any other releases yet. If your code does not pass the tests remotely, then you have to fix your code and re-release your project asv1.0.1since you now have 1 prior release. After your first code review, the next release will bev1.1.0(notice how the last number reset to 0).The release
v2.3.4means this release is for project 2, you have had 3 code reviews for project 2 so far, and this is the 4th release since your last code review of project 2. (It also means there must be a priorv2.3.3release made before this one.) -
Enter the tag number in the “Choose a tag” dropdown and click the “Create new tag on publish” option. If you are working ahead and have the project code in a different branch, select that branch in the “Target” dropdown.
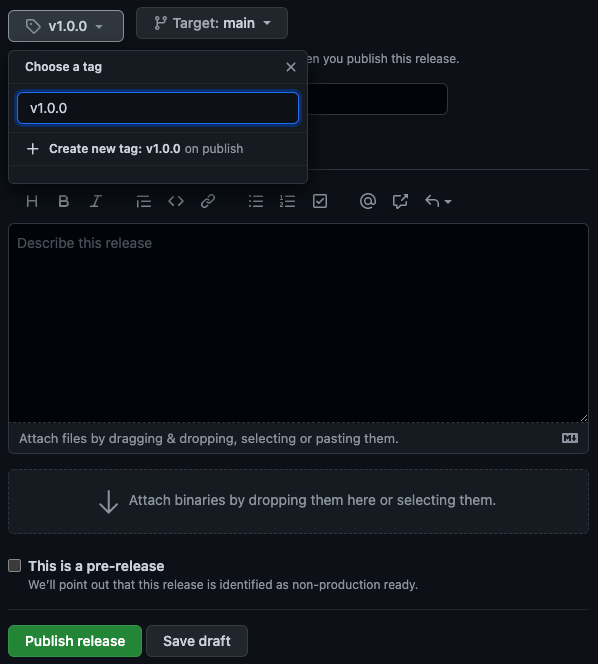
-
Click the “Publish release” button. You can leave the title and description blank. You should click the “This is a pre-release” checkbox unless you have passed code review, but it is not something we enforce currently.
You can see a sample release on the template repository.
Generally, you should not delete releases even if they are not passing tests.
Verification Action
Creating or editing a release triggers the “Run Project Tests” action in the “Actions” tab to run automatically. It will have the same title as the release tag:
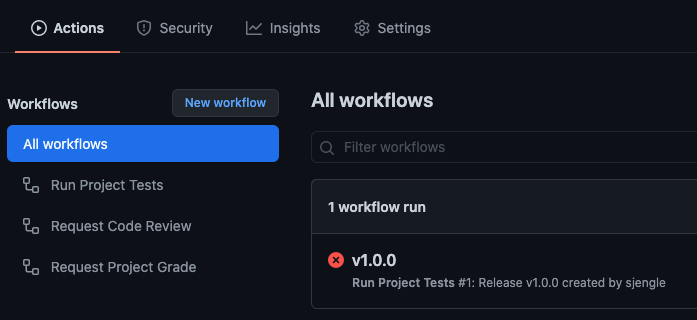
To view details, click on the run title. The yellow circle icon indicates the run or step is still in progress and has not yet completed. The red circle indicates the run or step failed (either because of setup issues or the tests failed). The green circle icon indicates the run or step completed and was successful (i.e. all tests passed).
You can see an example run in the template repository.
Debugging Failures
If the “Run Project Tests” action failed, you need to debug what went wrong. Details on what happened can be found in the detailed view, and reports and actual output files can be downloaded from the summary view.
The raw logs are always available, but debug output is only provided when the action fully completes but one or more tests fail.
Run Details
To see the detailed log of everything that happened, click the “Verification” link under the “Jobs” heading from the “Summary” view.
Look for the red circle icon to figure out which steps failed and click the greater-than icon to see the step details and the triangle or caret icon to open details within a step. You will often have to open the group just above the first error you find for the details.
If the “Pre Test Project” step failed, the action was not able to setup its virtual machine. This could be an issue with Github Actions or our verification script. Reach out Piazza with a link to your run for help.
If the error(s) appear in the “Test Project” step under the “Verification Setup Phase” heading, then your code could not be compiled. This could be related to compile issues that arise when using the javac compiler instead of the Eclipse compiler. Again, reach out privately on Piazza with a link directly to the issue in your run log for help.
If the error(s) appear after the “Verification Testing Phase” heading instead, it is likely that one or more tests failed. Open the “Running verification tests…” and “Running debug tests…” steps for details. This is the scenario illustrated in the example run log in the template repository.
You can also turn to the generated reports and actual output in that case, as discussed next.
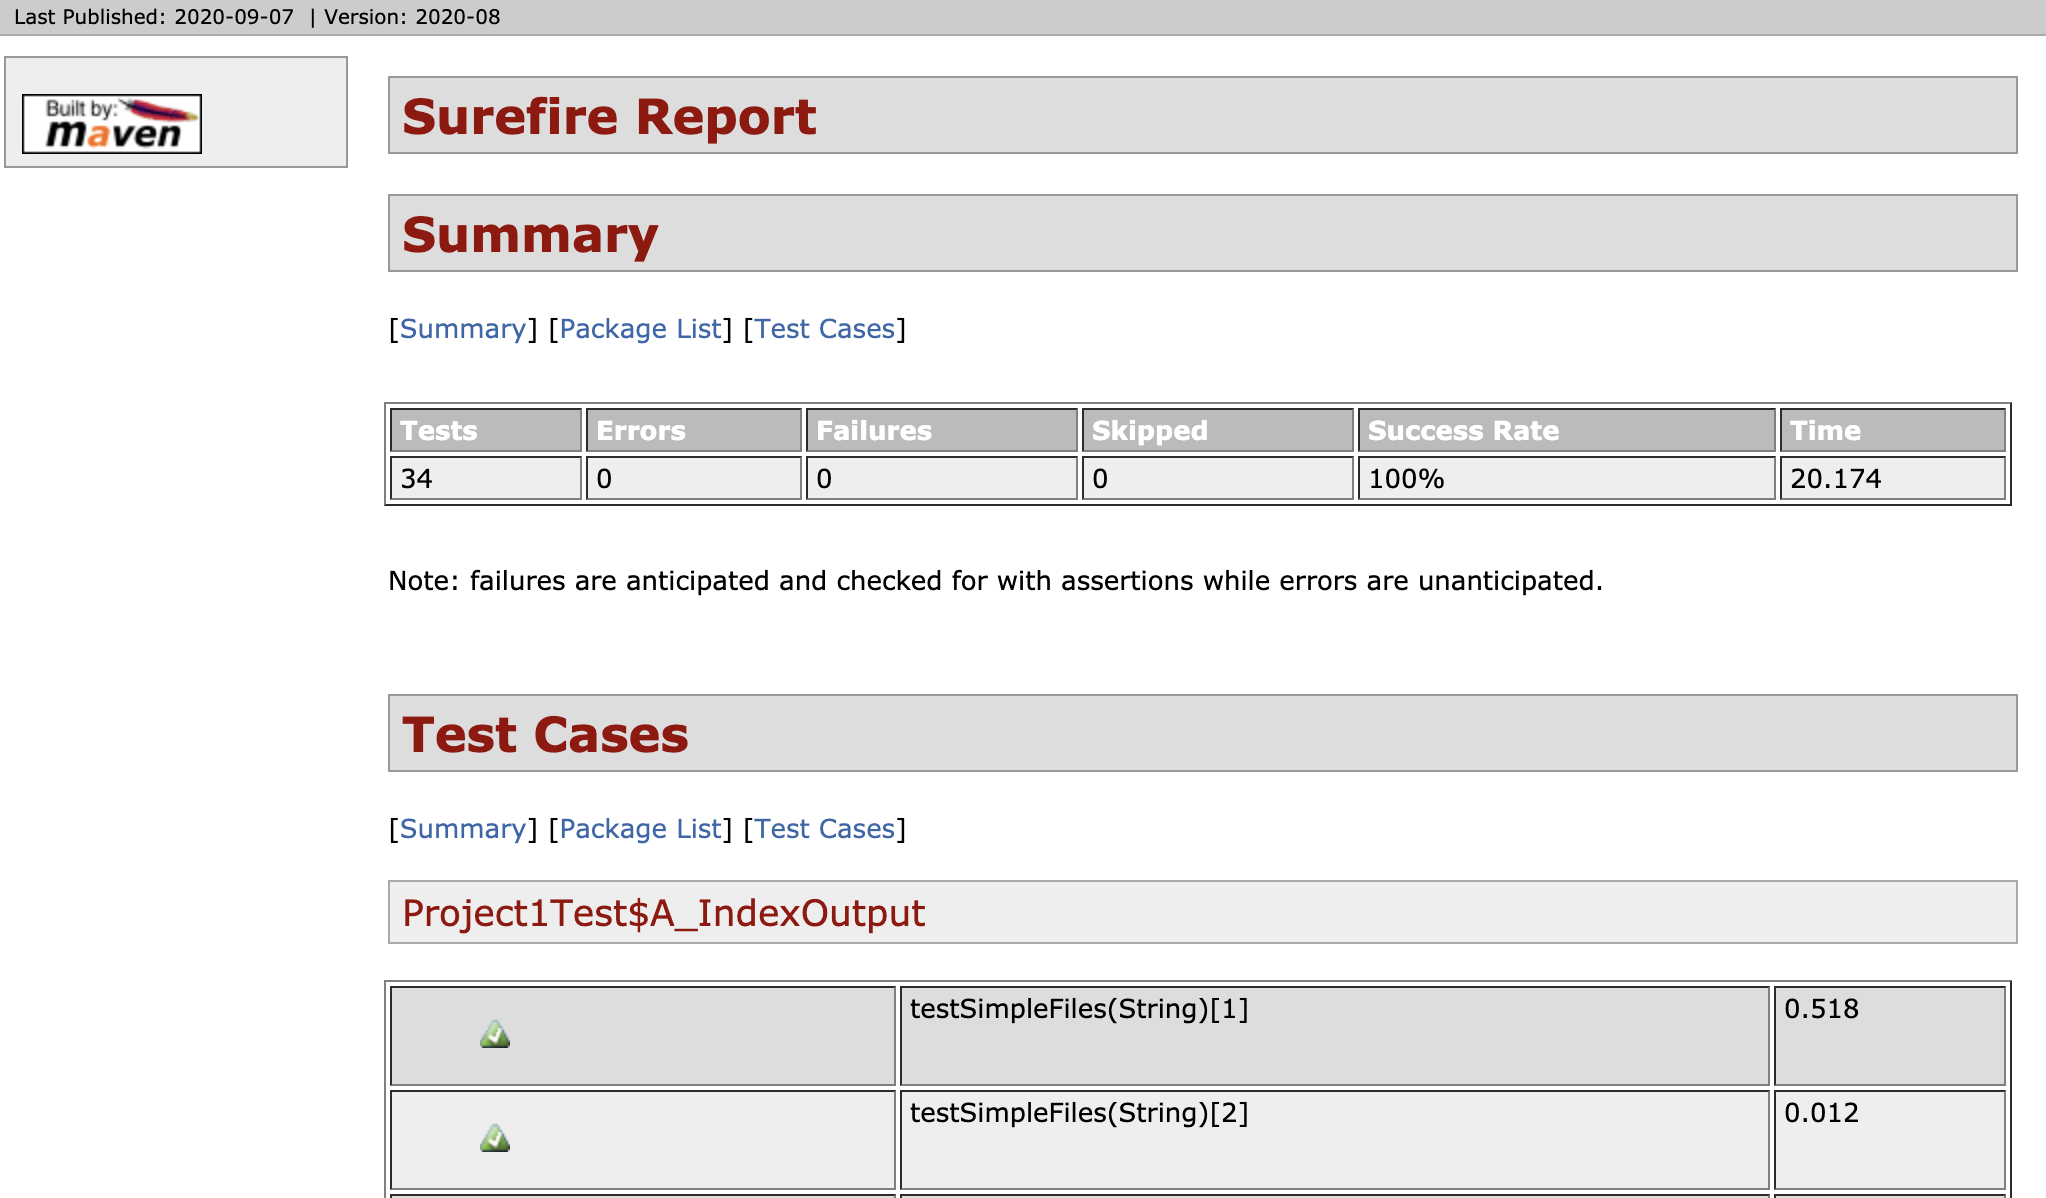
Generated Reports
As long as the “Test Project” step was able to compile and run the code, it will generate reports from running the tests (regardless if the tests pass or fail) in an easier-to-read HTML version:
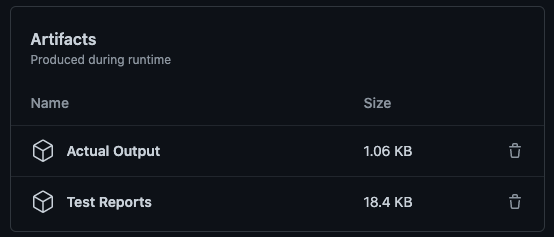
You can download these reports from the “Summary” view under the “Artifacts” heading:
You can see an example report in the template repository.
Actual Output
If the tests failed and generated actual output files, these will be available to download in the “Summary” view under the “Artifacts” heading. These are not included unless files were actually generated.
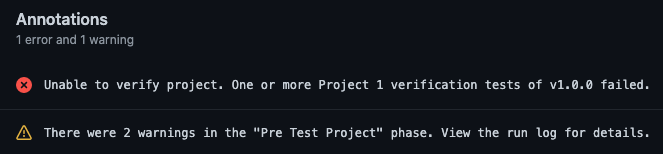
Checking Warnings
It is possible something went wrong with the Github Actions script itself. That is sometimes indicated by warnings. These might appear in the “Annotations” section:
And in the detailed run log:
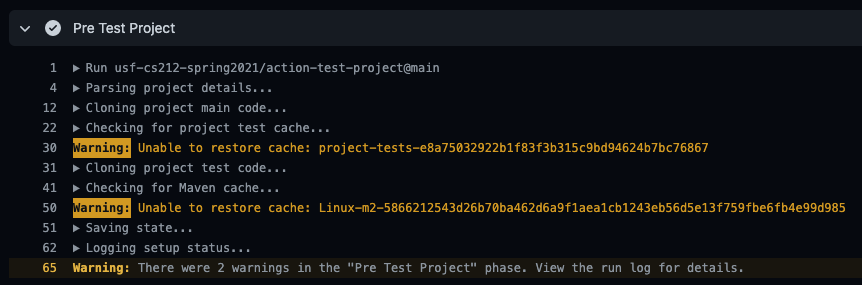
Most of the time, these can be ignored. For example, the warnings above happen anytime the test repository changes. They are only problematic if they show up in other situations as well. Sometimes, Github Actions also automatically adds warnings to indicate an pending change to their infrastructure.
If you are ever in doubt, do not hesitate to post on Piazza with a link to the warning.